Offline Global Tide Predictions
2026-03-27
Predicting the rise and fall of the tides can help with many coastal activities and is normally done on servers. The algorithm used in Trail Sense is able to calculate the tides offline, quickly, and without using a lot of storage space.
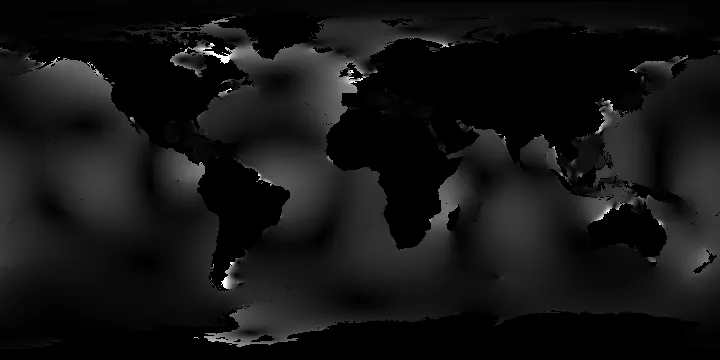 The M2 harmonic constituent amplitude from EOT20
Tidal Harmonics
Tides can be represented by "harmonic constituents," which are a series of waves defined by their amplitudes, phases, and speeds. By combining these waves, a new waveform is generated that represents the water level. The times of high and low tide can be determined as the local extrema of this waveform. Harmonic constituents correspond to real-world factors such as the position of the Earth relative to the Sun and Moon, as well as shallow-water interactions. Constituents are defined by a constant speed, which represents the frequency of the associated wave. For example, the S2 (solar semidiurnal) speed is 30 degrees/hour, which corresponds to a 12-hour period (half a day). The phase and amplitude of each of these constituents vary by location and are calculated through frequency analysis of water level data.
Before the tidal harmonics can be transformed into water levels, a correction/reference for each constituent wave needs to be calculated. These factors allow for the choice of a reference start date (say January 1, 2025, 0h UTC), and account for changes to the Sun-Earth-Moon system over time. Once a start date is chosen, these corrections can be precomputed and embedded as constants.
For each constituent, the following information is required:
- Speed: The definition of the constituent (constant).
- Amplitude: The (half) height of the wave (varies by location).
- Phase: The phase shift (offset) of the wave (varies by location).
- V + u: The phase correction of the constituent when t = 0, used to specify a start date (varies over time, can be precalculated as a constant with decent accuracy).
- f: The amplitude correction of the wave at a given time (varies over time, can be precalculated as a constant with decent accuracy).
Finally, the water level can be calculated as follows:
t = (currentTime - jan_1_2025_0utc).seconds
level = 0
for c in constituents
  level += c.f * c.amplitude * cos(c.speed * t + c.V + c.u - c.phase)
Data Gathering and Compression
To obtain harmonic constants across the globe, the EOT20 dataset can be used. This dataset is publicly available and contains harmonics for the entire ocean, which are calculated using a combination of satellite altimetry data.[1] The EOT20 dataset is on the order of gigabytes and therefore not feasible to ship in an Android app as-is. The data preprocessing algorithm for Trail Sense uses several steps:
- Obtain a land mask from Natural Earth and dilate it to mask out just the coastline of the EOT20 dataset.[2]
- Resize the resulting image to 720x360 (2 pixels per degree of latitude/longitude).
- Remap the amplitudes and phases to values between 0 and 255 to fit into a single byte. Record the maximum amplitude for each factor into metadata. If a constituent contains an amplitude over 500 cm, record that location into metadata and zero out the location in the remapped dataset; large amplitudes dilute the resolution of the remapped factor.
- Remove all land and open ocean pixels (leaving just the coastline) and resize the resulting array to have a width of 128 pixels. This loses spatial information, so create a 720x360 image (the index) of the coastline where the red channel is set to the X position of the array and the green channel is set to the Y position of the array.
- Write the images as lossless WebP files. The amplitudes and phases can optionally be merged into the same image files by writing them to the red, green, and blue channels.
The resulting images are under 300 KB in size, which is much better than 2+ gigabytes.
Decompression
The compressed data can be read using the following algorithm:
-
Convert the latitude and longitude to a pixel location (2 pixels per degree).
-
Load an 11x11 region of the indices image, centering the desired pixel. Handle wrapping on the X-axis. The size of this is adjustable depending on how far from the coast you want to display a tide.
-
Find the nearest non-black pixel to the center of the region.
-
Extract the X and Y coordinates of the compressed images:
X = pixel.red - 1 Y = pixel.green - 1 -
For each amplitude and phase file, load the X, Y pixel. Map it from [0, 255] to [0, max amplitude for constituent] and [-180, 180], respectively.
-
Plug the harmonic constituents into the water level formula. High/low tide times can be obtained via extrema finding.
Results
This algorithm was tested using 27 locations (covering all 7 continents and 5 oceans) and 30 days (spanning all 4 main phases of the Moon) to obtain the following results:
- Average error: 12 minutes
- 90% quantile error: 41 minutes
- Minimum error: 0 minutes
- Maximum error: 87 minutes
This level of accuracy is sufficient for Trail Sense. However, increasing the resolution of the tide images would reduce errors at the cost of a larger storage footprint.
Source code
References
-
Hart-Davis Michael, Piccioni Gaia, Dettmering Denise, Schwatke Christian, Passaro Marcello, Seitz Florian (2021). EOT20 - A global Empirical Ocean Tide model from multi-mission satellite altimetry. SEANOE. https://doi.org/10.17882/79489
-
Made with Natural Earth. Free vector and raster map data @ naturalearthdata.com.